1. Light Microscopy Lab Report
September 23, 2025
By: Ava Haynes
Cells are the basic structural and functional units of all living organisms, and they can be categorized as either prokaryotic or eukaryotic. Prokaryotic cells, such as bacteria and cyanobacteria, are simple in structure, lacking a true nucleus and membrane-bound organelles. In contrast, eukaryotic cells, which include both plant and animal cells, are more complex and contain a nucleus along with specialized organelles that perform specific functions.
This laboratory exercise aimed to observe and compare different types of cells under the microscope, including prokaryotic organisms like Rhodospirillum rubrum and Anabaena, and eukaryotic cells from plants (Elodea and onion) and animals (human cheek cells). By examining these samples, the structural differences between prokaryotic and eukaryotic cells, as well as between plant and animal cells, became more apparent. Through microscopic observation, the lab provided a visual understanding of how cell structure relates to function in various forms of life.


Biology, Howard University
Course Code:
LAB COORDINATOR: Dr. Iesha Fields
TA: Cayla Moore
Materials
Compound microscope
Microscopic slides and coverslips
Prepared slides of Rhodospirillum rubrum (prokaryotic)
Prepared slides of Anabaena or Nostoc (prokaryotic)
Toothpicks and razor blades
Dropper bottles of methylene blue dye, iodine solution, and water
Fresh onion (plant cell) and live Elodea (plant cell)
Beaker of disinfectant solution (10% bleach)
Methods
-
Microscope Testing:
-
Place the “letter e” slide on the stage and locate it under low power to practice focusing.
-
-
Observation of Rhodospirillum rubrum (Prokaryotic Cell):
-
Examine the prepared slide under the microscope.
-
Observe red, spiral, snake-like aggregates characteristic of bacterial cells.
-
-
Observation of Anabaena or Nostoc (Prokaryotic Cell):
-
Observe the blue-green cyanobacteria, noting their filamentous structure and lack of a defined nucleus.
-
-
Observation of Human Cheek Cells (Animal Cells):
-
Place a drop of methylene blue on a clean slide.
-
Gently scrape the inside of your cheek with a toothpick and mix the sample into the dye.
-
Cover with a coverslip and observe squamous epithelial cells with a distinct nucleus and “fried egg” appearance.
-
-
Observation of Onion Cells (Plant Cells):
-
Place a thin slice of onion on a slide, add two drops of iodine solution, and cover with a coverslip.
-
Observe the rectangular cell shape and clearly visible cell wall and nucleus.
-
-
Observation of Elodea (Plant Cells):
-
Observe chloroplasts and cell walls under the microscope.
-
Results
1. Rhodospirillum rubrum (Prokaryotic Cell)
Under the microscope, Rhodospirillum rubrum appeared as red, spiral-shaped or snake-like aggregates. The cells lacked a true nucleus and membrane-bound organelles. Their simple structure and shape were consistent with typical prokaryotic cells, which contain a cell wall composed of peptidoglycan but no chloroplasts or mitochondria.
2. Anabaena or Nostoc (Prokaryotic Cell)
The Anabaena or Nostoc sample showed blue-green filaments made up of chains of cells. These cyanobacteria did not have a defined nucleus but contained photosynthetic pigments, allowing them to perform photosynthesis even without chloroplasts. Their structure demonstrated another form of prokaryotic organization, with each cell performing basic life functions independently.
3. Human Cheek Cells (Eukaryotic Animal Cells)
The cheek cell slide revealed large, irregularly shaped squamous epithelial cells. Each cell had a clearly visible nucleus stained dark blue by methylene blue dye. The cytoplasm was visible around the nucleus, and no cell wall was present—only a flexible plasma membrane. These observations confirmed the eukaryotic nature of animal cells, which contain a nucleus and membrane-bound organelles.
4. Onion Cells (Eukaryotic Plant Cells)
The onion cell sample displayed rectangular cells arranged in a grid-like pattern. The iodine stain highlighted the nucleus and cell wall clearly. The rigid structure of the cell wall provided shape and support. No chloroplasts were visible since the onion bulb grows underground, where photosynthesis does not occur.
5. Elodea Cells (Eukaryotic Plant Cells)
Elodea cells were rectangular and contained numerous green chloroplasts that moved within the cytoplasm due to cytoplasmic streaming. The thick cell wall and central vacuole were also visible. These features demonstrated the main characteristics of plant cells, including photosynthesis and structural rigidity.
2. Nucleic Acids
September 23, 2025
By: Ava Haynes
In this lab, I will extract DNA by breaking open cells, releasing genetic material, and isolating pure DNA using reagents that mimic clinical buffers. This activity helps me understand how DNA behaves in cells and lays the foundation for learning about diagnostic tests, forensics, and molecular medicine.


Materials
-
Onion
-
Beaker
-
Homogenizing solution
-
Boiling water bath
-
Ice bath
-
Blender
-
Test tubes/containers
-
Ethanol
Methods
-
Dice the onion and place pieces into a beaker until they reach the first marking line.
-
Add the homogenizing solution to the beaker with the onions.
-
Place the mixture into boiling water for 15 minutes.
-
Transfer the beaker to an ice bath to stabilize the DNA.
-
Blend the cooled onion mixture for 30 seconds.
-
Return the blended mixture to the ice bath for 15 minutes.
-
Measure and transfer 10 mL of the mixture into a clean container or test tube.
-
Place the container back into the ice bath and allow it to cool.
-
Slowly add ethanol to the container to precipitate DNA.
-
Observe the DNA as it becomes visible.
Results
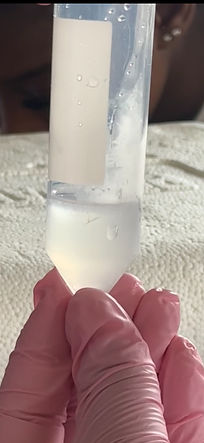
When ethanol was added to the onion and homogenizing solution mixture, visible DNA precipitated out of the solution. A thin, cloudy layer formed at the interface between the solution and the ethanol, and a small black speck appeared within the mixture. This speck represented extracted onion DNA. The appearance of the DNA confirmed that the extraction procedure was successful.
Biology, Howard University
Course Code:
LAB COORDINATOR: Dr. Iesha Fields
TA: Cayla Moore
3. Enzymatic Reactions
October 7th,
By: Ava Haynes
In this lab, I will be challenged to carefully follow step-by-step instructions to set up various experiments. I will extract the enzyme peroxidase from potatoes and perform several experiments to study its behavior under different conditions. These experiments will demonstrate the effects of temperature, enzyme concentration, and pH on enzymatic activity, as well as the impact of enzyme inhibition. Finally, I will collect and analyze the experimental data by plotting the results on graphs to better understand the relationships between these factors and enzyme function.
Biology, Howard University
Course Code:
LAB COORDINATOR: Dr. Iesha Fields
TA: Cayla Moore
Materials
-
Mortar and pestle
-
Conical centrifuge tubes
-
Centrifuge
-
Spectrophotometer
-
Vortex mixer
-
Test tubes/Spectrophotometer tubes (clean, numbered)
-
Ice bath
-
Water baths or incubators
-
Weighing balance
-
Spatula/scoop
Methods
-
1. Extraction of Peroxidase
-
Peel and weigh 8 g of potato.
-
Grind potatoes with sand using a mortar and pestle.
-
Add PBS buffer equal to potato mass (8 mL).
-
Transfer to a centrifuge tube and spin for 2 min at setting 5.
-
Decant supernatant into labeled tube and place on ice.
-
Use this extract as an enzyme source for all tests.
-
2. Effect of Enzyme Concentration
-
Label five spectrophotometer tubes (1–5).
-
Add PBS, peroxidase extract, and OPD according to the table.
-
Add hydrogen peroxide last to start the reaction.
-
Vortex tubes.
-
Incubate 15 min at room temperature.
-
Measure absorbance at 410 nm.
-
Graph absorbance vs. enzyme concentration.
-
3. Effect of Temperature
-
Label five tubes and add PBS + enzyme.
-
Incubate tubes at 0°C, 15°C, 22°C, 37°C, and 45°C for 10 min.
-
Add OPD and peroxide, vortex, and incubate 10 more minutes.
-
Read absorbance at 410 nm (blank using 0°C tube).
-
Graph enzyme activity vs. temperature.
-
4. Heat Denaturation Test
-
Add PBS + enzyme to 5 tubes.
-
Incubate at 22°C, 37°C, 55°C, 65°C, and 100°C for 10 min.
-
Allow tubes to cool 15 min.
-
Add OPD and peroxide, vortex, and incubate 15 min.
-
Record color intensity as an indicator of enzyme activity.
-
5. Effect of pH
-
Label six tubes and add pH buffers (pH 5, 7, or 9).
-
Add OPD, enzyme (or none for blanks), and peroxide.
-
Incubate 15 min at room temperature.
-
Measure absorbance at 410 nm.
-
Compare enzyme activity across pH conditions.
-
6. Enzyme Inhibition
-
Label four tubes.
-
Add catechol substrate, tyrosinase enzyme, and inhibitor depending on setup.
-
Vortex, incubate at room temp, observe color change every 10 min for 20 min.
-
Compare reactions with and without the inhibitor to classify the inhibition type.
Results
The results of this experiment demonstrated that peroxidase activity is influenced by enzyme concentration, temperature, pH, and the presence of inhibitors. Increasing the amount of enzyme led to a corresponding increase in absorbance at 410 nm, indicating greater production of the yellow oxidized OPD product and higher enzyme activity. Temperature affected reaction rate, with minimal activity at 0°C, moderate activity at room temperature (22°C), and maximum activity at approximately 37°C. Enzyme function declined at 45°C and was nearly eliminated after exposure to 65°C and 100°C, confirming denaturation at high temperatures. pH also played a significant role in enzyme performance, with optimal activity at neutral pH (7), reduced activity at pH 5, and further decline at pH 9. Finally, the inhibition test showed that the reaction containing phenylthiourea produced noticeably less color compared to the control, and enzyme function partially returned when more substrate was added, supporting competitive inhibition of tyrosinase.
4. Macromolecules
September 8th 2025
By: Ava. Haynes
This experiment was conducted to identify the presence of reducing sugars in various biological samples using Benedict’s test. Reducing sugars are carbohydrates capable of reducing cupric ions (Cu²⁺) in Benedict’s reagent to cuprous oxide (Cu⁺), which results in a visible color change when heated in a basic solution. By mixing each sample with Benedict’s reagent and heating it in a boiling water bath, the reaction allowed for the differentiation between reducing and non-reducing sugars based on color outcomes ranging from blue (no sugar present) to green, yellow, orange, or brick-red (increasing amounts of reducing sugar). This test provides a simple and reliable method for detecting biologically important carbohydrates in unknown samples.


Materials
-
5 test tubes
-
Test tube rack
-
Calibrated dropper
-
Benedict’s reagent
-
Samples (5 solutions as listed in Table 4.2)
-
Boiling water bath
-
Timer
-
Cooling area / room-temperature surface
-
Phone/camera for documentation
Methods
-
Label five test tubes 1–5.
-
Using a calibrated dropper, add 0.5 mL of each sample into the corresponding tubes according to Table 4.2.
-
Add 0.5 mL of Benedict’s reagent** to each test tube.
-
Place all tubes in a boiling water bath for 3 minutes.
-
Remove the tubes and allow them to cool to room temperature.
-
Observe and record any color change in each tube.
-
Take a photo of the test tubes to document results and upload to the ELN.
Results
After completing the Benedict’s test and allowing the test tubes to cool, noticeable differences in color change were observed among the samples. Samples containing reducing sugars showed a visible shift from the original blue color of the Benedict’s reagent to shades of green, yellow, orange, or brick-red, indicating the reduction of Cu²⁺ ions to Cu⁺ and confirming the presence of reducing sugars. Samples that did not contain reducing sugars remained blue with no visible reaction. All observations were recorded in the data table, and photographs of the test tubes were taken and included in the electronic lab notebook to document the results.
Biology, Howard University
Course Code:
LAB COORDINATOR: Dr. Iesha Fields
TA: Cayla Moore
5. Mendelian Genetics
November 4th 2025
By: Ava Haynes
This lab explored how genetic traits are passed from parents to offspring through Mendelian inheritance. Students reviewed the role of DNA, chromosomes, and alleles, and practiced modeling mitosis and meiosis to understand how cells divide and how gametes are formed. Probability and Punnett square models were used to predict offspring genotypes, and bead simulations demonstrated how random gamete pairing creates variation in traits. In addition, corn kernels were examined to analyze real phenotype ratios in nature. A chi-square test was performed to compare observed results to expected Mendelian ratios, helping determine whether the inheritance patterns followed Mendel’s laws of segregation and independent assortment.
Biology, Howard University
Course Code:
LAB COORDINATOR: Dr. Iesha Fields
TA: Cayla Moore
Materials
-
Lab handout/background information on Mendelian genetics
-
Paper and pencil / ELN for chromosome drawing exercises
-
Beads (2 colors — red & white) to simulate alleles
-
Two containers/cups for bead gamete simulation (Aa × Aa cross)
-
Corn ears for phenotype sampling
-
Data tables for recording kernel color counts
-
Calculator for chi-square analysis
-
Microscope diagrams or models (for mitosis/meiosis visualization)
Methods
-
Modeling Mitosis and Meiosis
-
Students practiced understanding inheritance by drawing and modeling how chromosomes behave during cell division. First, mitosis was modeled to show how one cell divides into two identical cells. Then, meiosis was modeled to show how chromosomes separate to form gametes with half the number of chromosomes and different allele combinations.
-
Bead Genetics Simulation (Aa × Aa Cross)
-
Two containers of beads (representing alleles A and a) were used to simulate gamete formation from two heterozygous parents. One bead was drawn from each container at a time to form a “zygote.” This process was repeated 100 times and each result was recorded. The observed data were compared to the expected Mendelian ratio using a chi-square test.
-
Corn Kernel Phenotype Observation
-
Corn ears were examined to count kernel color types. A sample of 100 kernels was collected and recorded. Expected values based on Mendelian inheritance were calculated. A chi-square test was used to compare observed and expected results to determine if the data supported Mendelian genetics.
Results
During the modeling activities, mitosis produced two identical cells, while meiosis produced gametes with half the number of chromosomes and different allele combinations. In the bead simulation of an Aa × Aa cross, the observed results were compared to the expected Mendelian ratio, and the chi-square test showed whether any differences were due to chance. In the corn kernel investigation, different kernel colors were counted, and the results were also compared to expected Mendelian ratios. Overall, the data supported Mendelian inheritance by showing predictable patterns in how traits are passed from parents to offspring.